Last year I deleted my GoodReads account and signed up for StoryGraph. Between the awful GoodReads experience on mobile and sharing unnecessary amounts of reading data with Amazon, I decided enough was enough.
I wouldn’t have done it if I didn’t have an alternative, though, because I like having an easy way to track my books. No laborious spreadsheets for me, thanks! And that alternative was StoryGraph, which proved not only to be an adequate GoodReads replacement but an actual improvement. In addition to a much smoother and functional interface on mobile (though there is a web version as well!), it tracks a greater variety of data and uses it to help you better understand your reader rather than to feed the Bezos beast. It also lets you play with that data in better detail. What better way to show that off than by sharing my 2022 Reading Wrap-Up from StoryGraph!
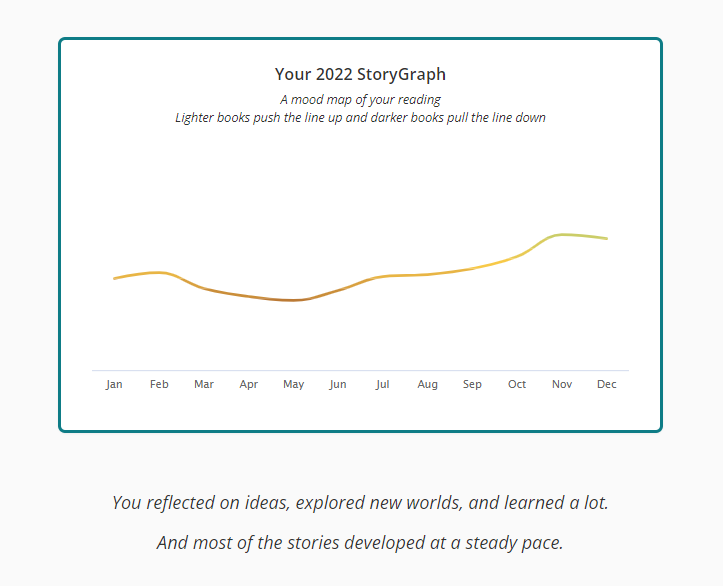
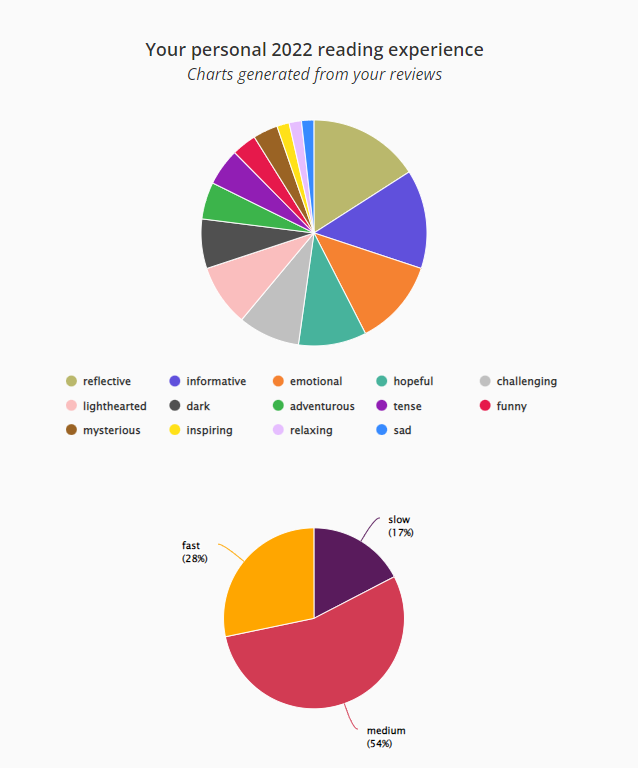
It’s unclear how they are categorizing “light” and “dark” books on the site, precisely. StoryGraph gives you the option of selecting “moods” for books as you add them, which I assume this graph is referring to. (“This would be good for someone in the mood for something…”) My guess is that moods like “tense” or “sad” count as dark, and that ones like “hopeful” or “adventurous” count as light, but that’s just hypothesizing. Apparently I was in a real bummer reading mood for the entire spring!
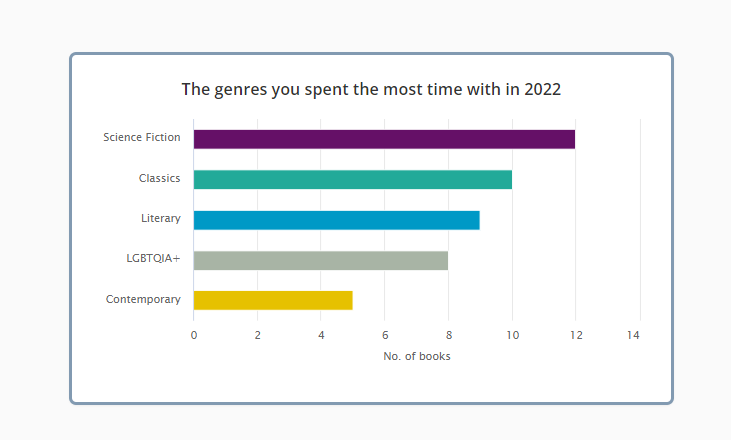
No surprise that science fiction tops the list. Austin Feminist Sci Fi Book Club keeping me on my toes!

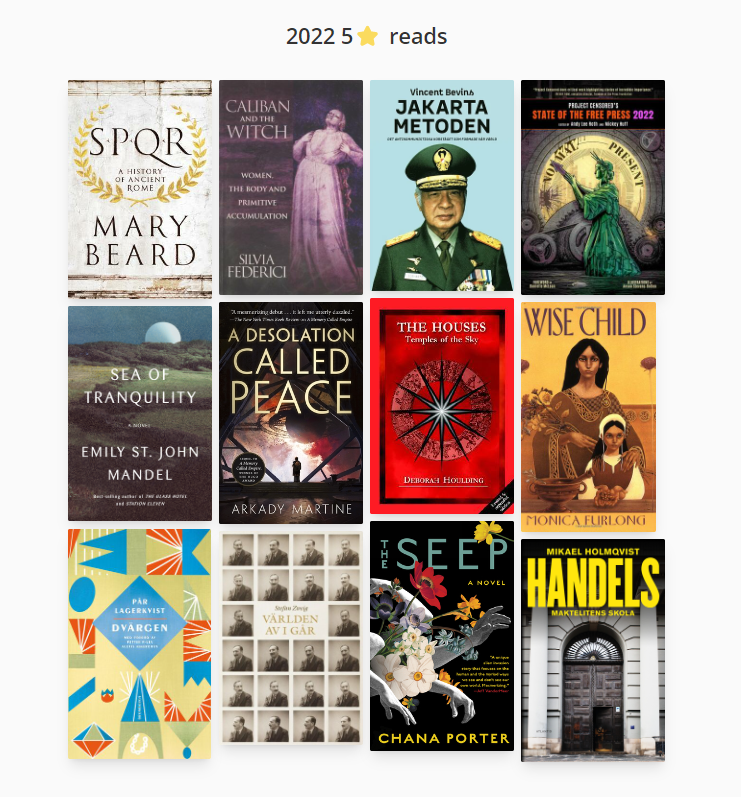
Ones that I discussed here were:
- Jakartametoden
- Sea of Tranquility
- A Desolation Called Peace
- Wise Child
- Dvärgen
- Världen av i går
- The Seep
- Handels: Maktelitens skola
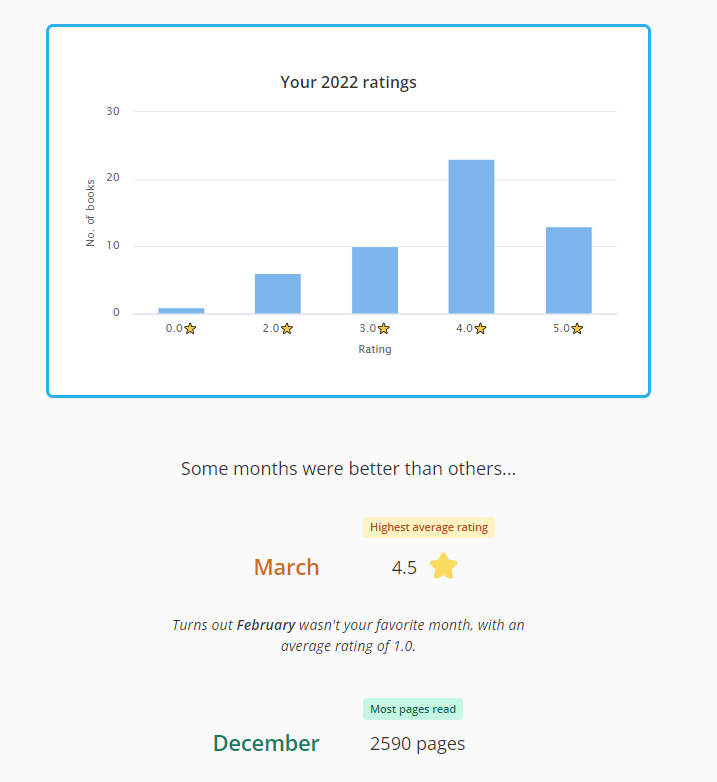
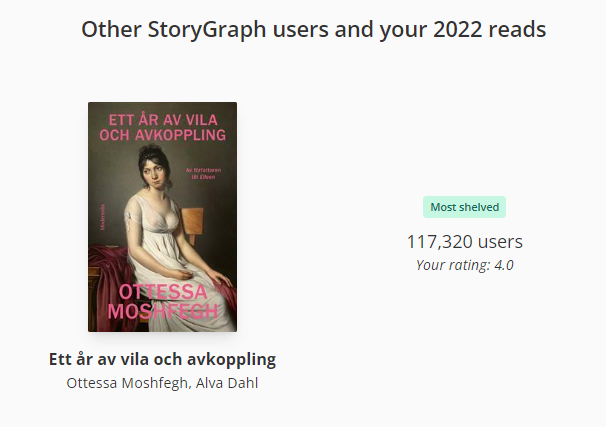
Sometimes numbers surprise you. Despite the 3.75 star average, I wasn’t expecting to see quite so many 4 star ratings in my stats (I promise I know how math works). My philosophy is that if your average rating over a whole year reaches or exceeds 4 out of 5 stars, you are either being overly generous with your opinions or insufficiently adventurous with your choices. Or you are possibly DNF-ing every single mediocre book you pick up, which is a choice I respect.
Another great thing about StoryGraph: it lets you give 0 star reviews, which is exactly what I gave Into the Drowning Deep.
StoryGraph also provides the “least shelved” book you read—the book you read that the fewest number of users have added to their own lists, whether they’ve read it or only intend to—and the “highest rated” book you read—the book you read that has the highest rating on the site. My “least shelved” book was a self-published novel that I panned (seems pointlessly cruel to share that) and my “highest rated” is niche and of no interest here, so I’m omitting those two.
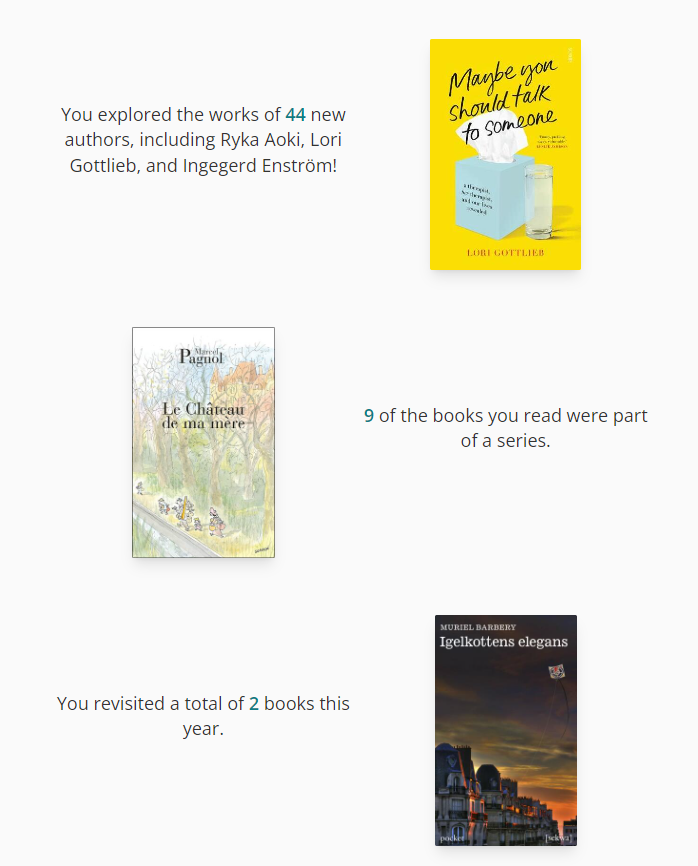
Speaking of re-reads, I’ll take the opportunity to point out that adding re-reads of books in different languages (which was both of those re-reads) is much easier to do on StoryGraph than on GoodReads.

So there you have it! Maybe that enticed you to give StoryGraph a shot? Nothing about this post is paid or sponsored, I just think the service is that cool and I want it to succeed wildly.